In short
Mortality is a key indicator for the surveillance of the COVID-19 epidemic, by informing health authorities and the general public about the course and the severity of the COVID-19 epidemic in Belgium. However, the standard registration procedure of the specific causes of death through death certificates is typically a 2 to 3-year process in Belgium. For this reason, an ad hoc surveillance of COVID-19 deaths was established to respond to this public health emergency.
Project description
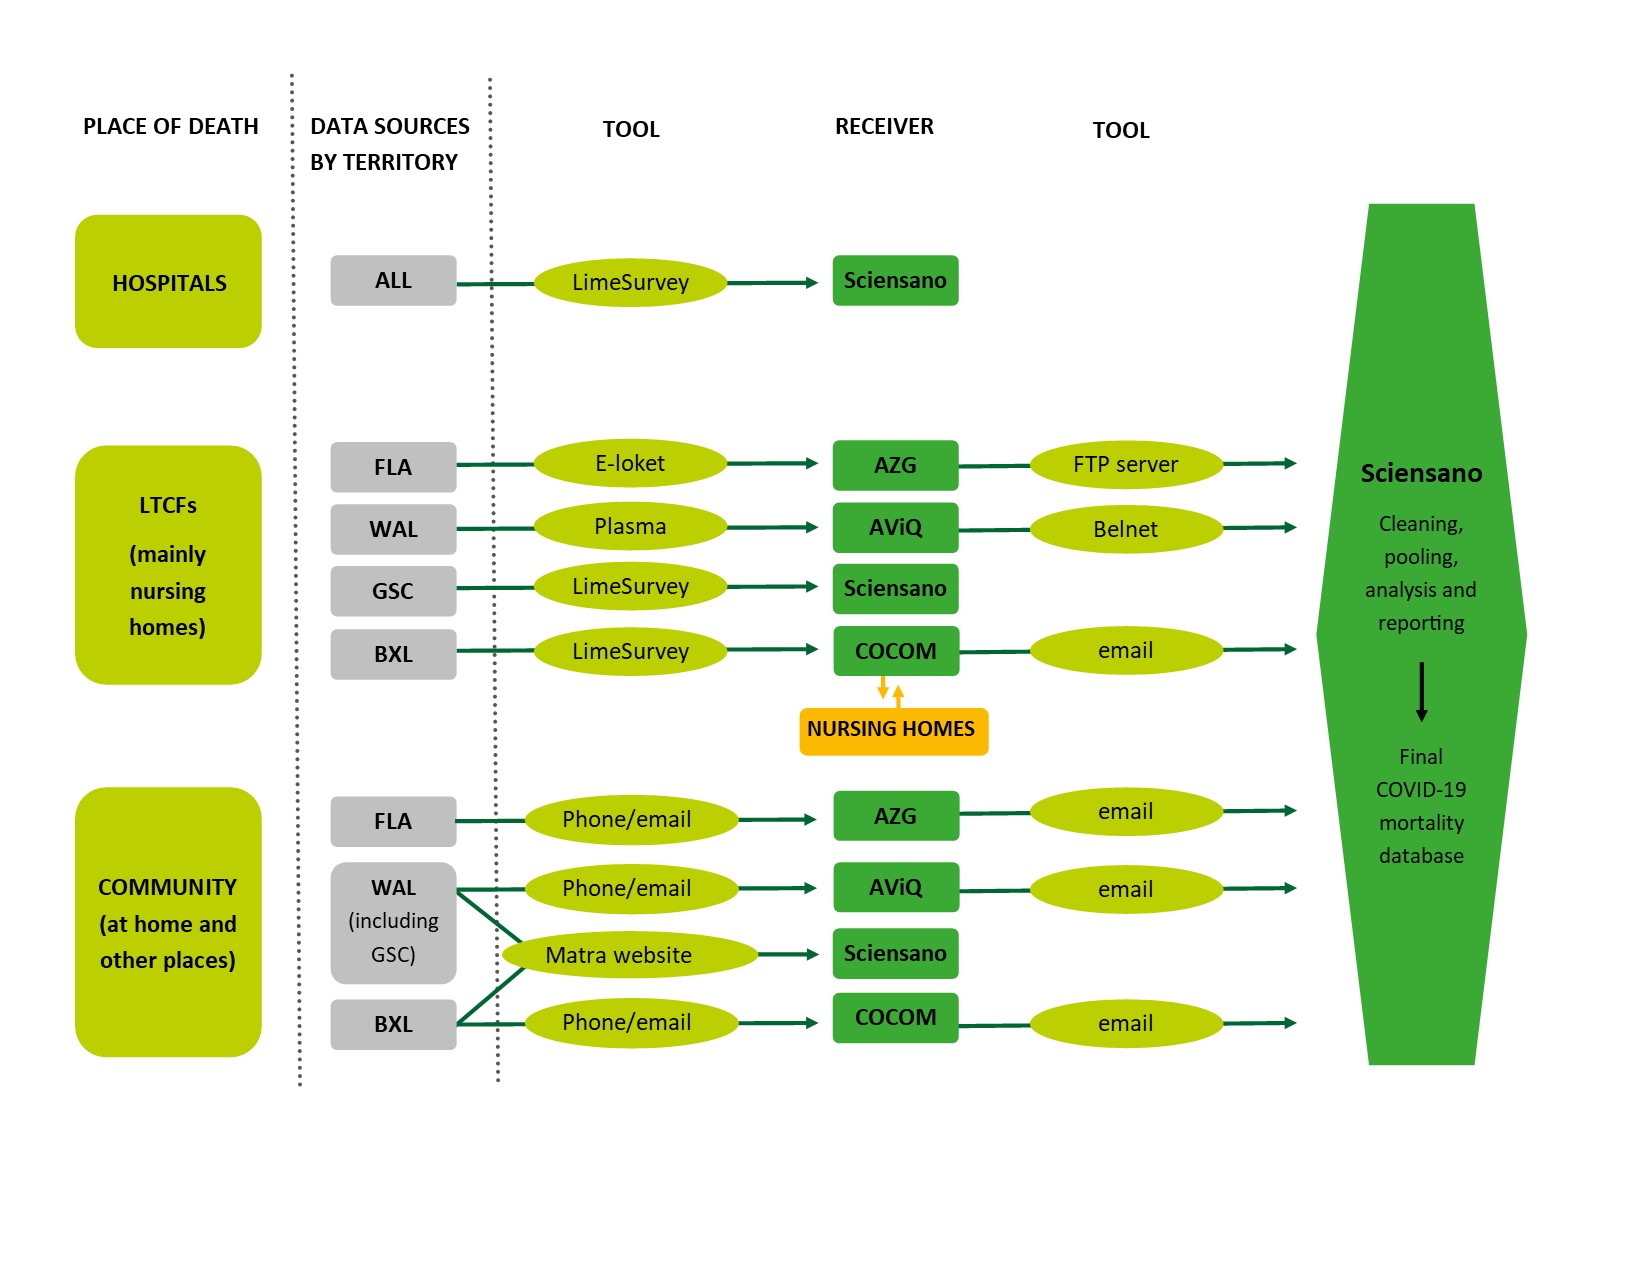
The epidemiological surveillance of COVID-19 mortality was put into place to acquire real-time COVID-19 mortality data and to monitor the severity of the SARS-CoV-2 virus. As illustrated in Figure 1, the surveillance combined information on COVID-19 related deaths from three places of death (in hospitals, in long-term care facilities and in the community), using the hospital surveillance (surge capacity survey), the nursing home surveillance, and notifications of deaths to regional health inspection authorities. The data flow was conducted through nine different channels depending on the type of place of death and the territory where the death occurred.
Sciensano collected, verified, validated and consolidated these data at the national level and ensured the analysis and publication of the COVID-19 related deaths.
Sciensano made the information on the epidemiological evolution of the COVID-19 epidemic in Belgium available to health authorities, to scientists and to the general public. Policy makers used it to take appropriate support actions. The results of the mortality and other surveillances also allowed for (inter)national comparative analyses in cooperation with other researchers.
 Figure 1: Dataflow of the epidemiological surveillance of COVID-19 mortality from the 1st of March 2023. (Overview of the dataflow until February 28th 2023: click here.)
AViQ: Agence pour une Vie de qualité; AZG: Agentschap Zorg en Gezondheid; BXL: Brussels-Capital Region; COCOM: Commission Communautaire Commune de la Région de Bruxelles-Capitale; COVID-19: coronavirus disease; FLA: Flanders; FPS public health : Federal public service Public Health, Food Chain Safety and Environment of Belgium; GSC: German-speaking Community; LTCF: long-term care facilities; WAL: Wallonia.
The yellow line represents the exchanges between COCOM and the nursing homes for data quality before sending the data to Sciensano.
- Tools: The data platforms used were different for each territory.
- Belnet FileSender: national platform for secure data transmission);
- e-loket: specific online tool for AZG;
- LimeSurvey;
- Matra website: specific online tool from Sciensano;
- Plasma: specific online tool for AViQ.
Results
- Epidemiological figures about the COVID-19 epidemic in Belgium
- COVID-19 Dashboard
- Daily and weekly epidemiological reports (available in Dutch and French)
- In depth reports about the COVID-19 mortality
- Renard F. et al. (2021). Establishing an ad hoc COVID-19 mortality surveillance during the first epidemic wave in Belgium, 1 March to 21 June 2020. Eurosurveillance 26 (48).
- Report about the surveillance of COVID-19 mortality in Belgium during the first and second wave of the epidemic
- Report about the excess mortality during the first and second waves of the COVID-19 epidemic in Belgium
- Bustos Sierra N., Bossuyt N., Braeye T. et al. (2020). All-cause mortality supports the COVID-19 mortality in Belgium and comparison with major fatal events of the last century. Arch Public Health 78, 117.
- Report about the surveillance of COVID-19 mortality in Belgium from wave 1 to wave 7
- Other useful links